If like many developers you use webviewers to interact with your FileMaker solutions, you may have noticed that it is not so easy to debug the content of a webviewer, whether for HTML / CSS rendering or the execution of your JavaScript code.
One solution is to copy the content of the webviewer into an .html file and then use a browser's web inspector, which works well but causes a lot of back and forth between FileMaker Pro, your text editor, and your browser…
There is a much more practical solution!
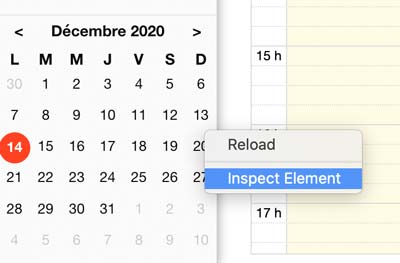
In Mac-OS and FileMaker Pro 19, it is possible to display the Safari web inspector with a simple right-click on the webviewer you want to debug. (see below for earlier versions of FileMaker Pro)
To do this you must first close FileMaker Pro 19.
Then using a terminal, run the following command:
defaults write com.filemaker.client.pro12 WebKitDebugDeveloperExtrasEnabled -bool YESOnce the command is executed, open your FileMaker solution and right click on the webviewer you want to analyze, the “Inspect Element” command should appear.

If you don't have FileMaker Pro 19, do not panic, it is still possible to activate the option.
FileMaker Pro 18 / 17 :
First close FileMaker Pro 18 or 17.
Then in a terminal, run the following command:
defaults write com.FileMaker.client.pro12 WebKitDebugDeveloperExtrasEnabled -bool YESThis solution will really make your life easier with the integration of web viewers.